***
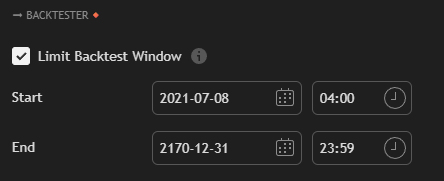
* **Limit Backtest Window** – Restricts backtesting to a specific date range.
* **Start / End** – Defines the backtesting period.
***
The **Conditions Reference** defines all available logic triggers used within the **BigBeluga Backtester**.\
Each condition represents a specific signal or event generated by one of the three integrated systems — **Market Waves Toolkit**, **Core Toolkit**, or **Nautilus System**.
***
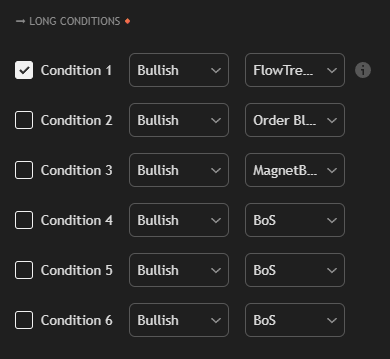
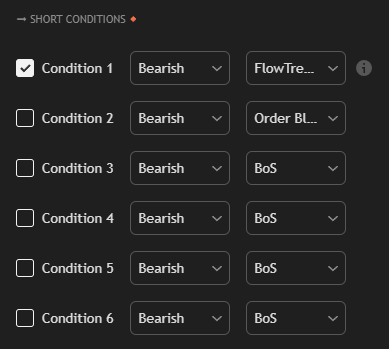
These settings define the conditions for entering **long (buy)** and **short (sell)** trades. Each condition is checked sequentially to confirm an entry signal.
Every condition can be independently enabled, set to a bullish or bearish direction, and stacked with others to create multi-factor confluence setups.
This modular design ensures that each backtest reflects a trader’s unique execution logic and market interpretation.
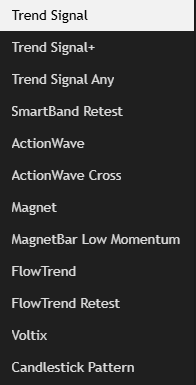
MARKET WAVES CONDITIONS
[**Trend Signal / Trend Signal+ / Trend Signal Any**](https://docs.bigbeluga.com/toolkits/market-waves-pro-tm/trend-signals)\
Detects directional shifts based on the *Market Waves Trend Engine*.
* *Trend Signal*
* *Trend Signal+* 
* *Trend Signal Any* triggers on any bullish or bearish, combining both types for broader detection.
[**SmartBand Retest**](https://docs.bigbeluga.com/screener/market-echo-screener-tm/smart-bands)\
Signals when price retests the dynamic trend band after a breakout. \
Often marks optimal pullback entries aligned with the dominant trend direction.
[**ActionWave / ActionWave Cross**](https://docs.bigbeluga.com/toolkits/market-waves-pro-tm/actionwave)\
Captures momentum swings inside the wave structure.
* *ActionWave* triggers on confirmed directional bias (bullish or bearish).
* *ActionWave Cross* activates when price crosses the ActionWave’s volatility thresholds, confirming breakout momentum.
[**Magnet / MagnetBar Low Momentum**](https://docs.bigbeluga.com/toolkits/market-waves-pro-tm/trendmagnet)\
Detects price attraction toward equilibrium zones (“magnets”) defined by volatility compression.
* [*Magnet* ](https://docs.bigbeluga.com/toolkits/market-waves-pro-tm/trendmagnet#dynamic-trend-band)confirms directional alignment with the magnet trend.
* [*MagnetBar Low Momentum*](https://docs.bigbeluga.com/toolkits/market-waves-pro-tm/trendmagnet#momentum-weakness-detection) highlights low-volatility setups just before potential impulsive moves.
[**FlowTrend / FlowTrend Retest**](https://docs.bigbeluga.com/screener/market-echo-screener-tm/flowtrend)\
Identifies higher-timeframe directional flow using smoothed trend envelopes.
* [*FlowTrend* ](https://docs.bigbeluga.com/toolkits/market-waves-pro-tm/flow-trend#trend-signals)determines whether market flow is bullish or bearish.
* [*FlowTrend Retest*](https://docs.bigbeluga.com/toolkits/market-waves-pro-tm/flow-trend#retest-signals) activates when price revisits the flow boundary, a common area for continuation entries.
[**Voltix**](https://docs.bigbeluga.com/toolkits/market-waves-pro-tm/voltix-bands)\
[A volatility-based signal](https://docs.bigbeluga.com/toolkits/market-waves-pro-tm/voltix-bands#reversal-signals) indicating mean reversion or expansion.\
Useful for filtering breakout vs. compression phases in trend-following or mean-reversion systems.
[**Candlestick Pattern**](https://docs.bigbeluga.com/toolkits/market-waves-pro-tm/candlestick-patterns)\
Triggers when a selected candle pattern (e.g., Engulfing, Hammer, Star, Doji, etc.) appears, confirming short-term exhaustion or continuation signals within the broader structure.
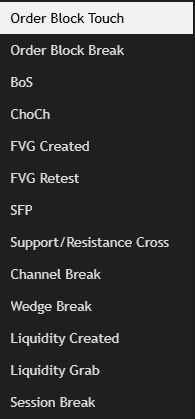
MARKET CORE CONDITIONS
[**Order Block Touch/Break**](https://docs.bigbeluga.com/toolkits/market-core-pro-tm/order-blocks)\
OB touch triggers when price taps into the boundaries of a recent bullish or bearish Order Block.\
Used to confirm institutional mitigation points where price reacts to previously unfilled orders.
OB break activates when price fully closes beyond the top or bottom of an Order Block.\
This typically signals that institutional order flow has shifted and prior zones are invalidated.
[**BoS (Break of Structure)/ChoCh (Change of Character)**](https://docs.bigbeluga.com/toolkits/market-core-pro-tm/market-structure)\
Bos detects when price breaks above a previous swing high or below a prior swing low, confirming continuation of the existing trend.\
A bullish BoS validates trend expansion, while a bearish BoS confirms downward momentum.
Choch identifies the first structural break in the opposite direction of the prevailing trend.\
It serves as an early signal of a potential market reversal or phase shift in structure.
[**FVG Created**](https://docs.bigbeluga.com/toolkits/market-core-pro-tm/fair-value-gap)\
Marks the formation of a new Fair Value Gap — an imbalance between buying and selling pressure.\
It highlights areas where price moved too quickly, leaving inefficient trading zones.
[**FVG Retest**](https://docs.bigbeluga.com/toolkits/market-core-pro-tm/fair-value-gap)\
Triggers when price revisits an existing Fair Value Gap.\
Often signals rebalancing or continuation after inefficiency has been filled.
[**SFP (Swing Failure Pattern)**](https://docs.bigbeluga.com/toolkits/market-core-pro-tm/swing-failure-pattern)\
Detects failed attempts to make new highs or lows, typically forming liquidity grabs.\
A bullish SFP indicates a sweep below previous lows before reversing upward; a bearish SFP indicates a sweep above highs followed by rejection.
[**Support / Resistance Cross**](https://docs.bigbeluga.com/toolkits/market-core-pro-tm/support-and-resistance)\
Activates when price crosses a key support or resistance level detected by the system’s dynamic algorithm.\
Useful for breakout or trend-confirmation logic when market structure expands beyond consolidation.
[**Channel Break**](https://docs.bigbeluga.com/toolkits/market-core-pro-tm/chart-patterns#channels)\
Identifies the breakout of a parallel channel to confirm directional acceleration.
* *Bearish Channel Break* occurs when price breaks below a descending or neutral channel.
* *Bullish Channel Break* occurs when price breaks above an ascending or neutral channel.
[**Wedge Break**](https://docs.bigbeluga.com/toolkits/market-core-pro-tm/chart-patterns#wedges)\
Detects a breakout from contracting wedge formations (rising or falling).\
This typically signals momentum release after a volatility squeeze or exhaustion pattern.
[**Liquidity Created**](https://docs.bigbeluga.com/toolkits/market-core-pro-tm/liquidity-concepts#liquidity-grab)\
Marks the formation of local liquidity pools — areas where resting orders (stop losses) accumulate above highs or below lows.\
These zones often attract price before significant moves.
[**Liquidity Grab**](https://docs.bigbeluga.com/toolkits/market-core-pro-tm/liquidity-concepts#liquidity-grab)\
Triggers when price sweeps through previously identified liquidity levels and reverses, confirming that stop-hunt activity has occurred.\
It’s commonly used to detect manipulation or reversal setups around liquidity clusters.
[**Session Break**](https://docs.bigbeluga.com/toolkits/market-core-pro-tm/session-opening)\
Activates when price breaks beyond the range of a defined trading session (e.g., New York or London open).\
This condition helps isolate intraday volatility bursts and range expansions.
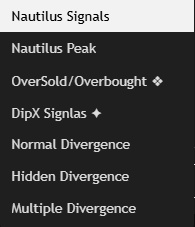
NAUTILUS CONDITIONS
[**Nautilus Signals**](https://docs.bigbeluga.com/oscillators/nautilus-tm/signals#buy-and-sell-signals)\
Triggers when the Nautilus oscillator detects a short-term momentum reversal.\
A bullish signal appears when downside momentum weakens and upward pressure emerges; a bearish signal appears when upward momentum exhausts.
[**Nautilus Peak**](https://docs.bigbeluga.com/oscillators/nautilus-tm/signals#bullish-and-bearish-peaks)\
Marks major oscillator peaks or troughs corresponding to cycle extremes.\
Used to confirm overextended conditions in trend continuation or exhaustion setups.
[**OverSold / OverBought ❖**](https://docs.bigbeluga.com/oscillators/nautilus-tm/signals#yellow-diamonds-overbought-and-oversold)\
Signals when the Nautilus oscillator crosses key overbought (above +80) or oversold (below –80) thresholds.\
These levels indicate potential reversal or exhaustion zones, useful for timing exits or counter-trend entries.
[**DipX Signals ✦**](https://docs.bigbeluga.com/oscillators/nautilus-tm/signals#diamonds-bullish-dipx-and-bearish-dipx)\
Identifies fast-reacting reversals known as “dip-recoveries.”\
A *Bullish DipX* indicates a quick rebound from temporary weakness; a *Bearish DipX* marks short-term exhaustion after an impulsive rally.
[**Normal Divergence**](https://docs.bigbeluga.com/oscillators/nautilus-tm/divergence-detection#normal-divergence)\
Detects classic divergences between price and the Nautilus oscillator.\
A *Bullish Divergence* forms when price makes a lower low while momentum rises, hinting at reversal strength; *Bearish Divergence* does the opposite.
[**Hidden Divergence**](https://docs.bigbeluga.com/oscillators/nautilus-tm/divergence-detection#hidden-divergence)\
Identifies continuation-type divergences, confirming trend strength rather than reversal.\
For example, price makes a higher low while the oscillator makes a lower low (bullish continuation).
[**Multiple Divergence**](https://docs.bigbeluga.com/oscillators/nautilus-tm/divergence-detection#multiple-divergence)\
Signals when multiple divergence events occur consecutively, adding higher confluence to potential reversals or continuation zones.\
This helps traders quantify the strength of accumulated momentum dissonance before a major move.
{% hint style="info" %}
Long and short entries mirror each other but apply to opposite market directions.
{% endhint %}
***
By unifying conditions from **Market Waves**, **Core**, and **Nautilus**, traders can transform complex discretionary systems into fully testable models — enabling true data-driven strategy refinement and performance optimization.