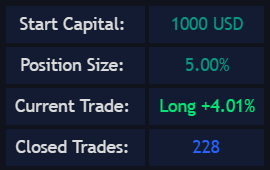
# Dashboard
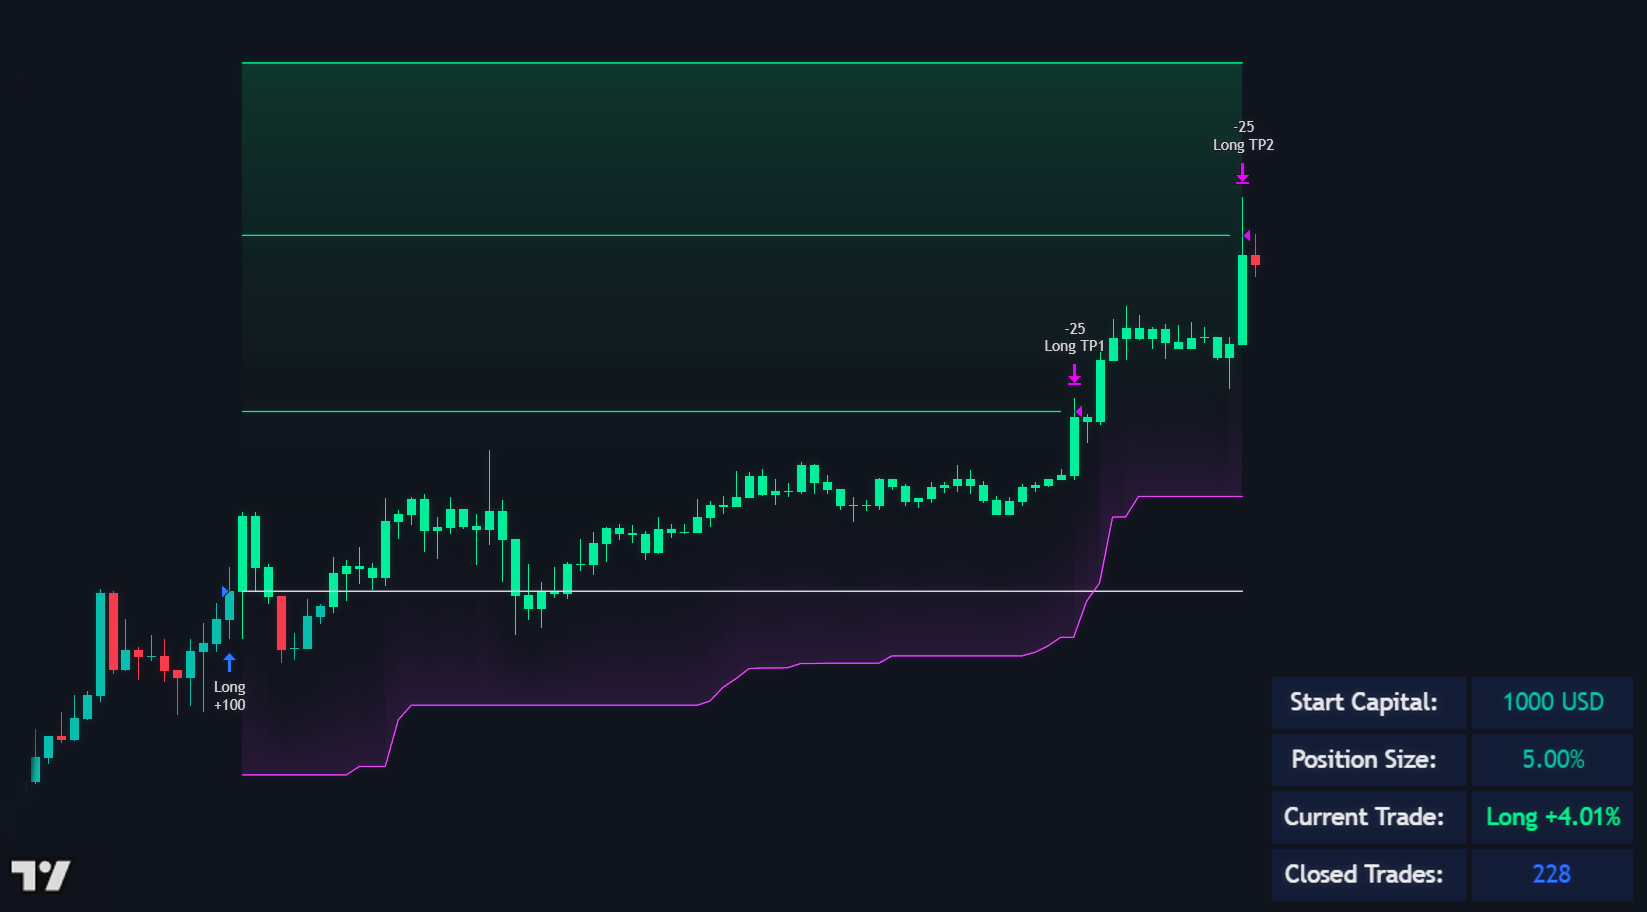
The **Dashboard** provides real-time visual feedback on backtest performance and trade statistics.\
It summarizes essential information about capital allocation, trade direction, and performance progress directly on the chart — helping traders monitor active simulations without opening additional reports.
***
{% hint style="info" %}
#### **Dashboard Metrics**
* **Start Capital**\
Displays the initial account balance used for the backtest.\
This value is defined in the [Properties Initial Capital](https://docs.bigbeluga.com/backtesters/properties#capital) settings and remains static throughout the simulation (default: *1000 USD*).
* **Position Size**\
Shows the current trade size as a percentage of total account equity.\
It reflects the *default quantity type* set in the [Properties order size](https://docs.bigbeluga.com/backtesters/properties#capital) (e.g., 5% of equity per trade).
* **Current Trade**\
Indicates the direction and real-time performance of the active position.
* Displays *Long* or *Short* along with the percentage gain/loss since entry.
* Positive trades are shown in **green**, negative trades in **blue** for quick visual distinction.
* **Closed Trades**\
Tracks the total number of completed trades during the backtest session.\
This metric helps evaluate system frequency and sample size quality for statistical analysis.
{% endhint %}
The dashboard automatically updates at the close of every bar, ensuring live synchronization with ongoing backtest data.
***
Its minimalist layout is designed for quick readability, allowing traders to gauge capital health, exposure, and system behavior at a glance — especially during long-term simulations.